Washington, DC, Oct. 28, 2015, — nationsreportcard.gov released latest National Achievement Level Results (NALR) today. This year, students had an average score in reading of 223 points at grade 4 and 265 points at grade 8 on separate 0-500 point scales. The 2015 average score was not significantly different at grade 4 and was 2 points lower at grade 8 compared to 2013. Scores at both grades were higher in 2015 than those from the earliest reading assessments in 1992 by 6 points at grade 4 and 5 points at grade 8.
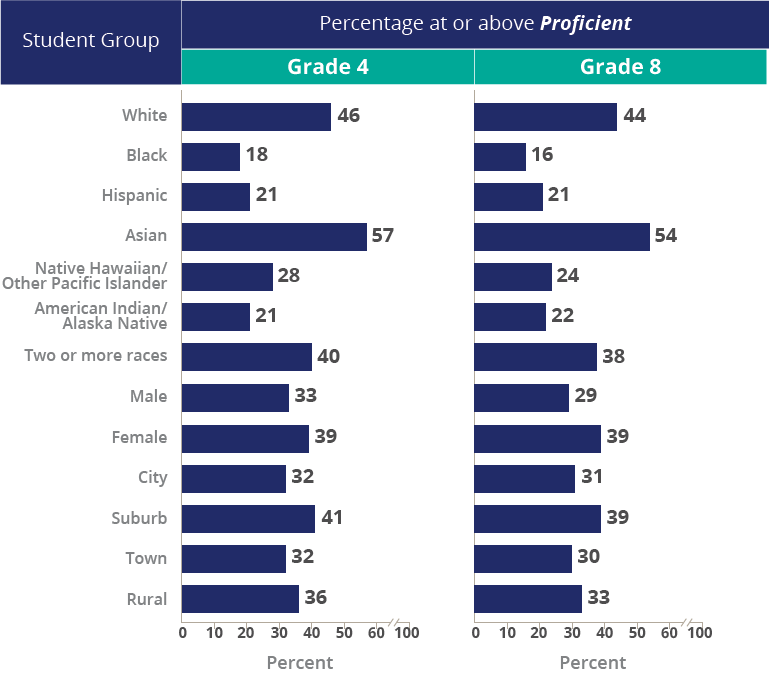
In 2015, more than one-third of fourth- and eighth-graders performed at or above the Proficient achievement level in reading. In 2015, the percentages of selected student groups (shown in the figure below) performing at or above Proficient at grade 4 ranged from 18 percent for Black students to 57 percent for Asian students. At grade 8, the percentages at or above Proficient ranged from 16 percent for Black students to 54 percent for Asian students.
NOTE: Accommodations were not permitted in NAEP reading assessments prior to 1998. Results are not shown for data points where the sample sizes are insufficient to permit a reliable estimate or where data are not available. Black includes African American, and Hispanic includes Latino. Race categories exclude Hispanic origin. In compliance with new standards from the U.S. Office of Management and Budget for collecting and reporting data on race/ethnicity, additional information was collected beginning in 2011 so that results could be reported separately for Asian students and Native Hawaiian/Other Pacific Islander students. Students who identified with two or more of the other racial/ethnic groups (e.g., White and Black) would have been classified as “other” and reported as part of the “unclassified” category prior to 2011, and classified as “two or more races” in 2011 and later assessment years. For the National School Lunch Program (NSLP) eligibility category, results for assessment years prior to 2003 are not reported because of the improved quality of the data on students’ eligibility for the school lunch program beginning in 2003. Beginning in 2014-15 school year, states could additionally categorize students as eligible for NSLP by including them in their Community Eligibility Provision; therefore, the percentage of students categorized as eligible has increased in comparison to 2013. Readers should interpret NSLP trend results with caution. See more information about racial/ethnic categories and the availability of the NSLP data at
http://nces.ed.gov/nationsreportcard/reading/interpret-results.aspx.
The category students with disabilities includes students identified as having either an Individualized Education Program or protection under Section 504 of the Rehabilitation Act of 1973. The results for students with disabilities and English language learners are based on students who were assessed and cannot be generalized to the total population of such students. Detail may not sum to totals because of rounding. Not all apparent differences are statistically significant.
SOURCE: U.S. Department of Education, Institute of Education Sciences, National Center for Education Statistics, National Assessment of Educational Progress (NAEP), various years, 1992–2015 Reading Assessments.